Components
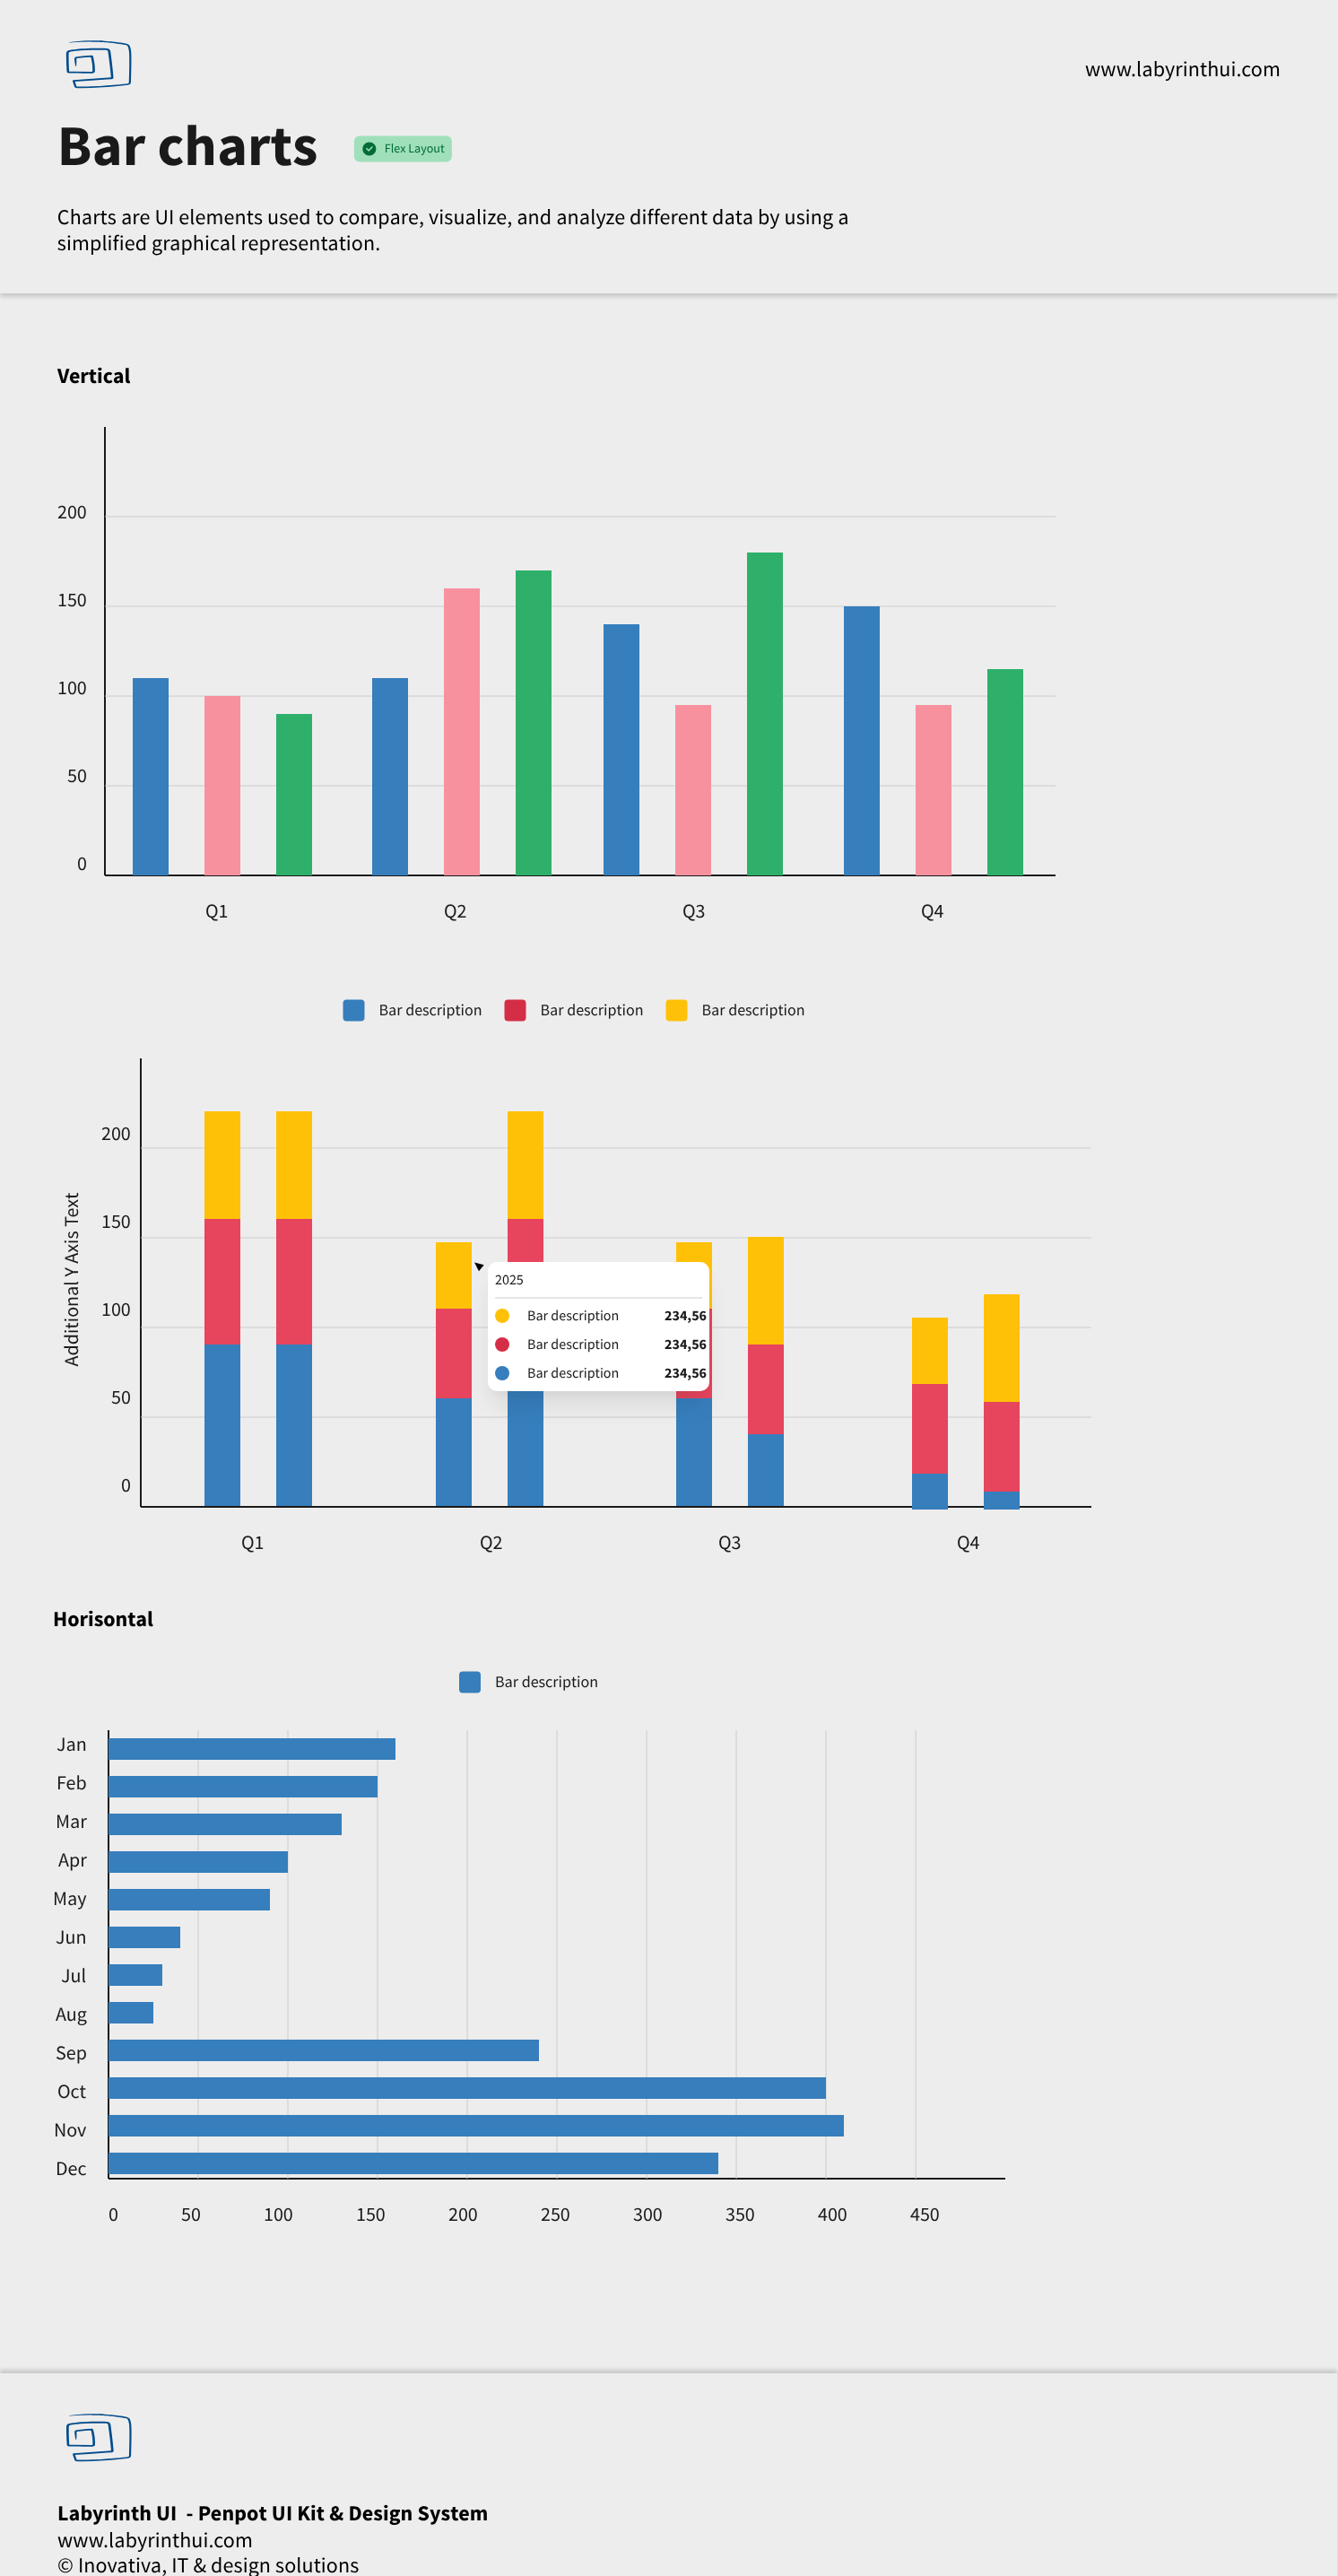
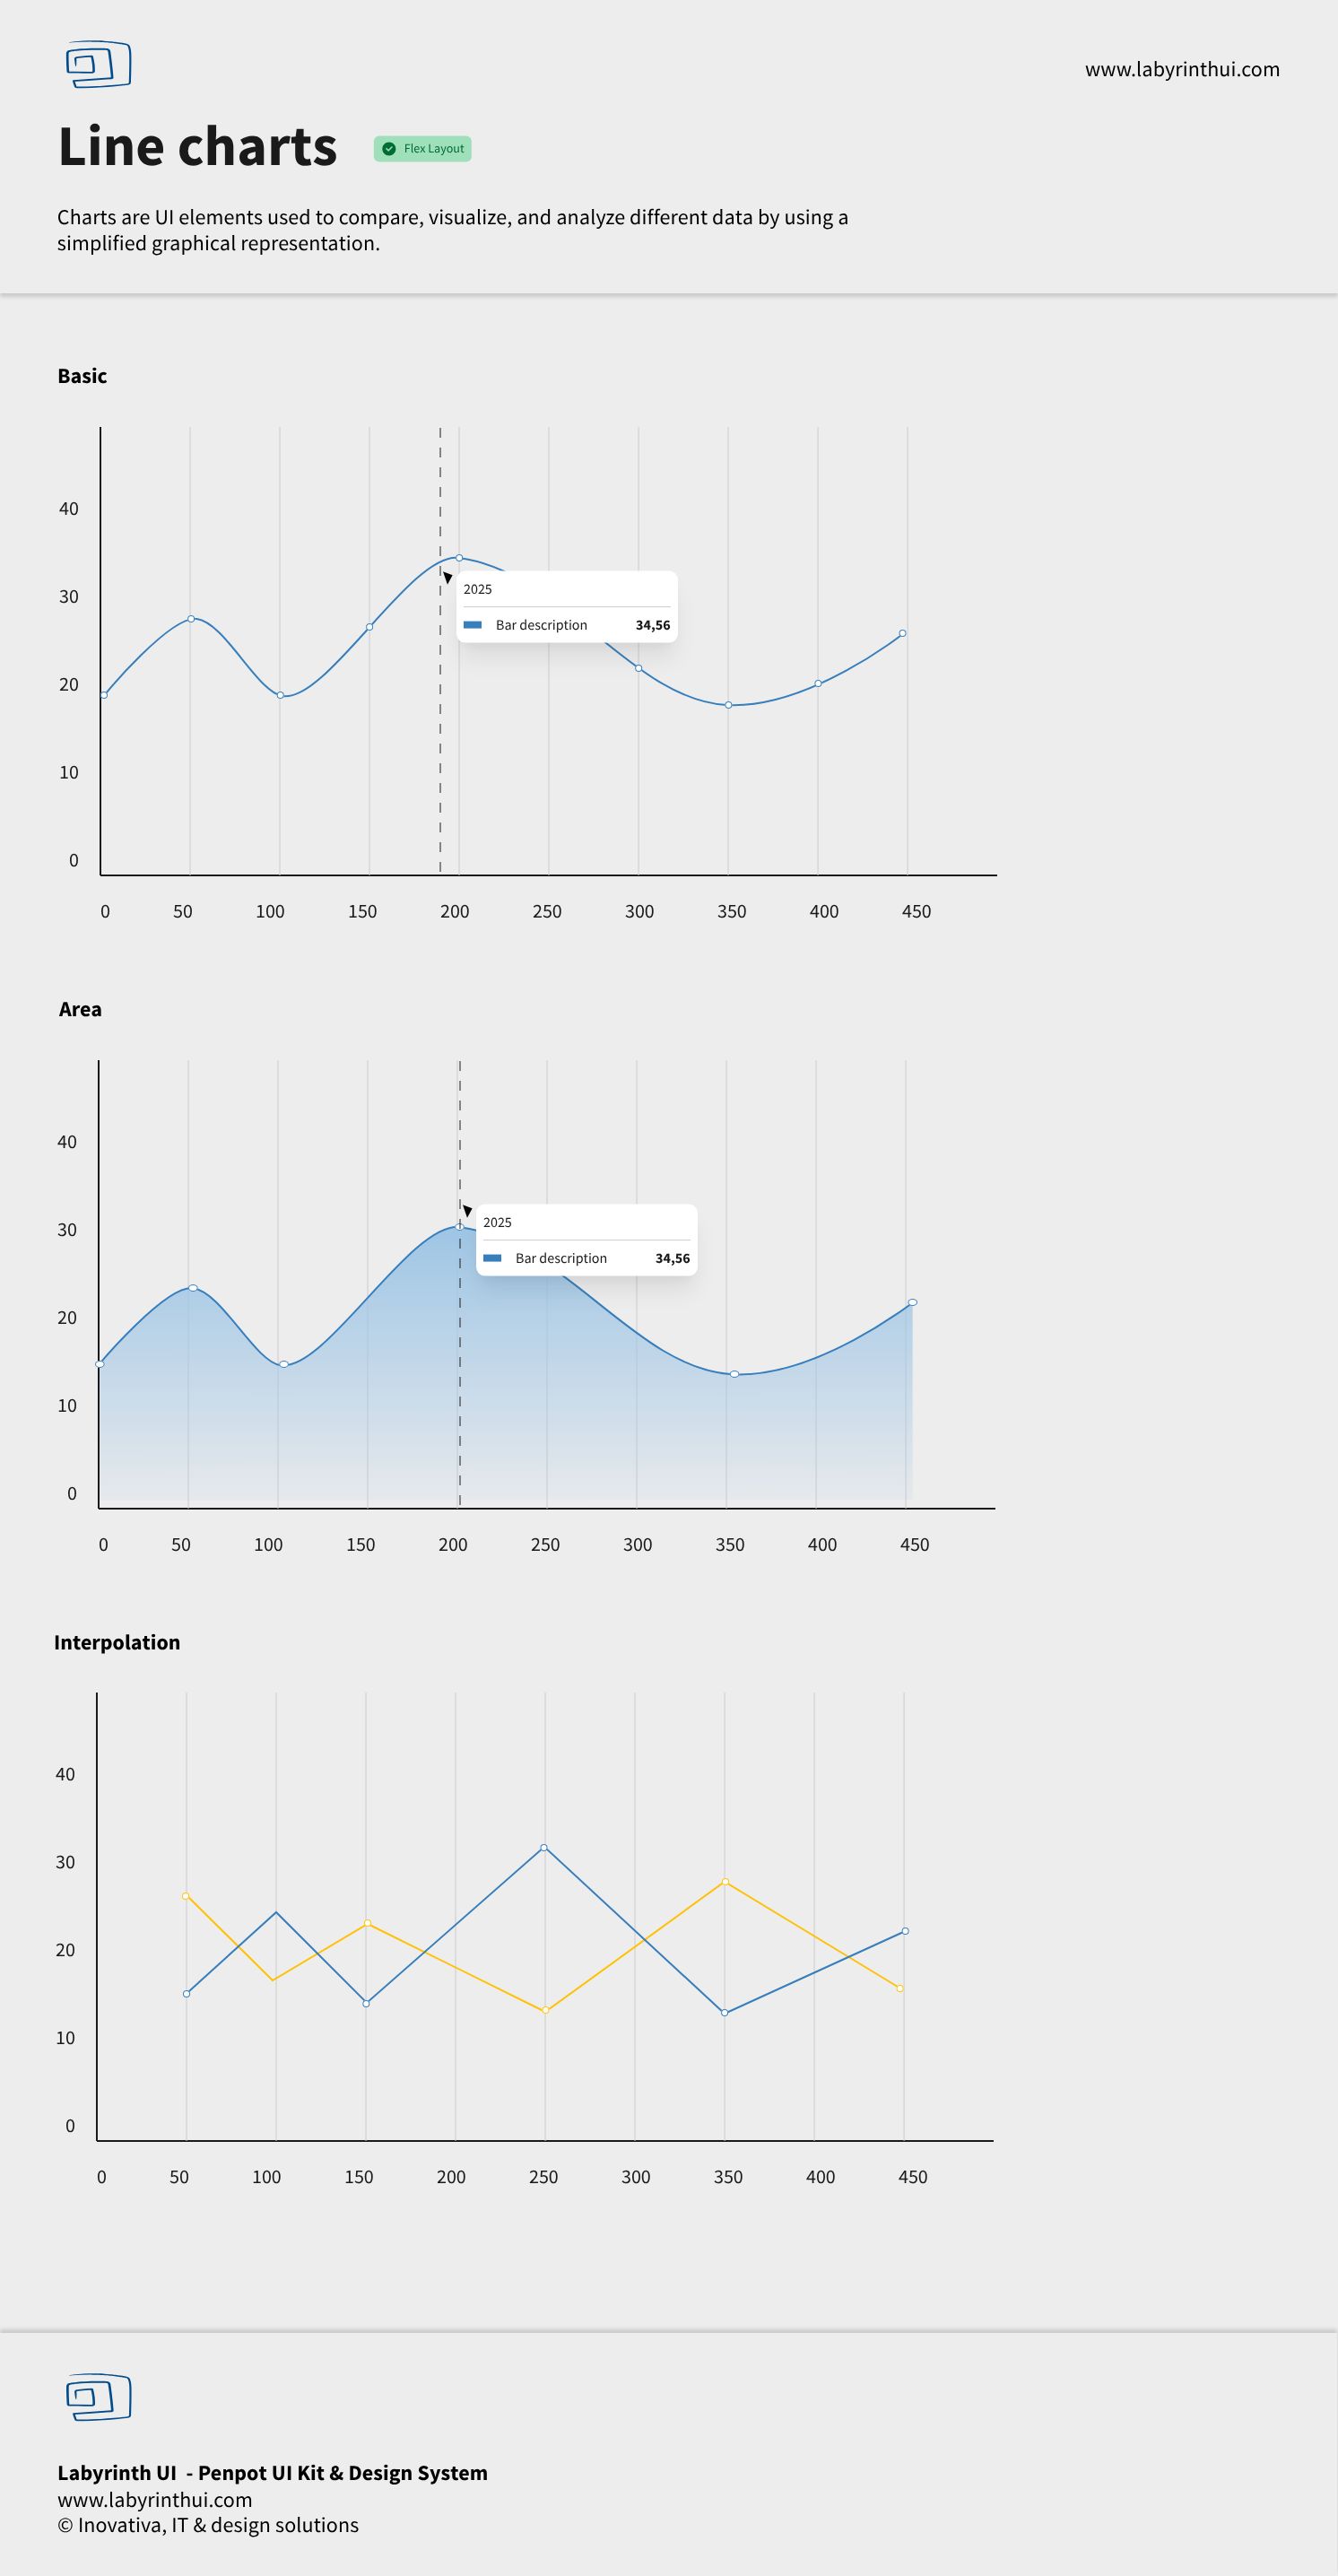
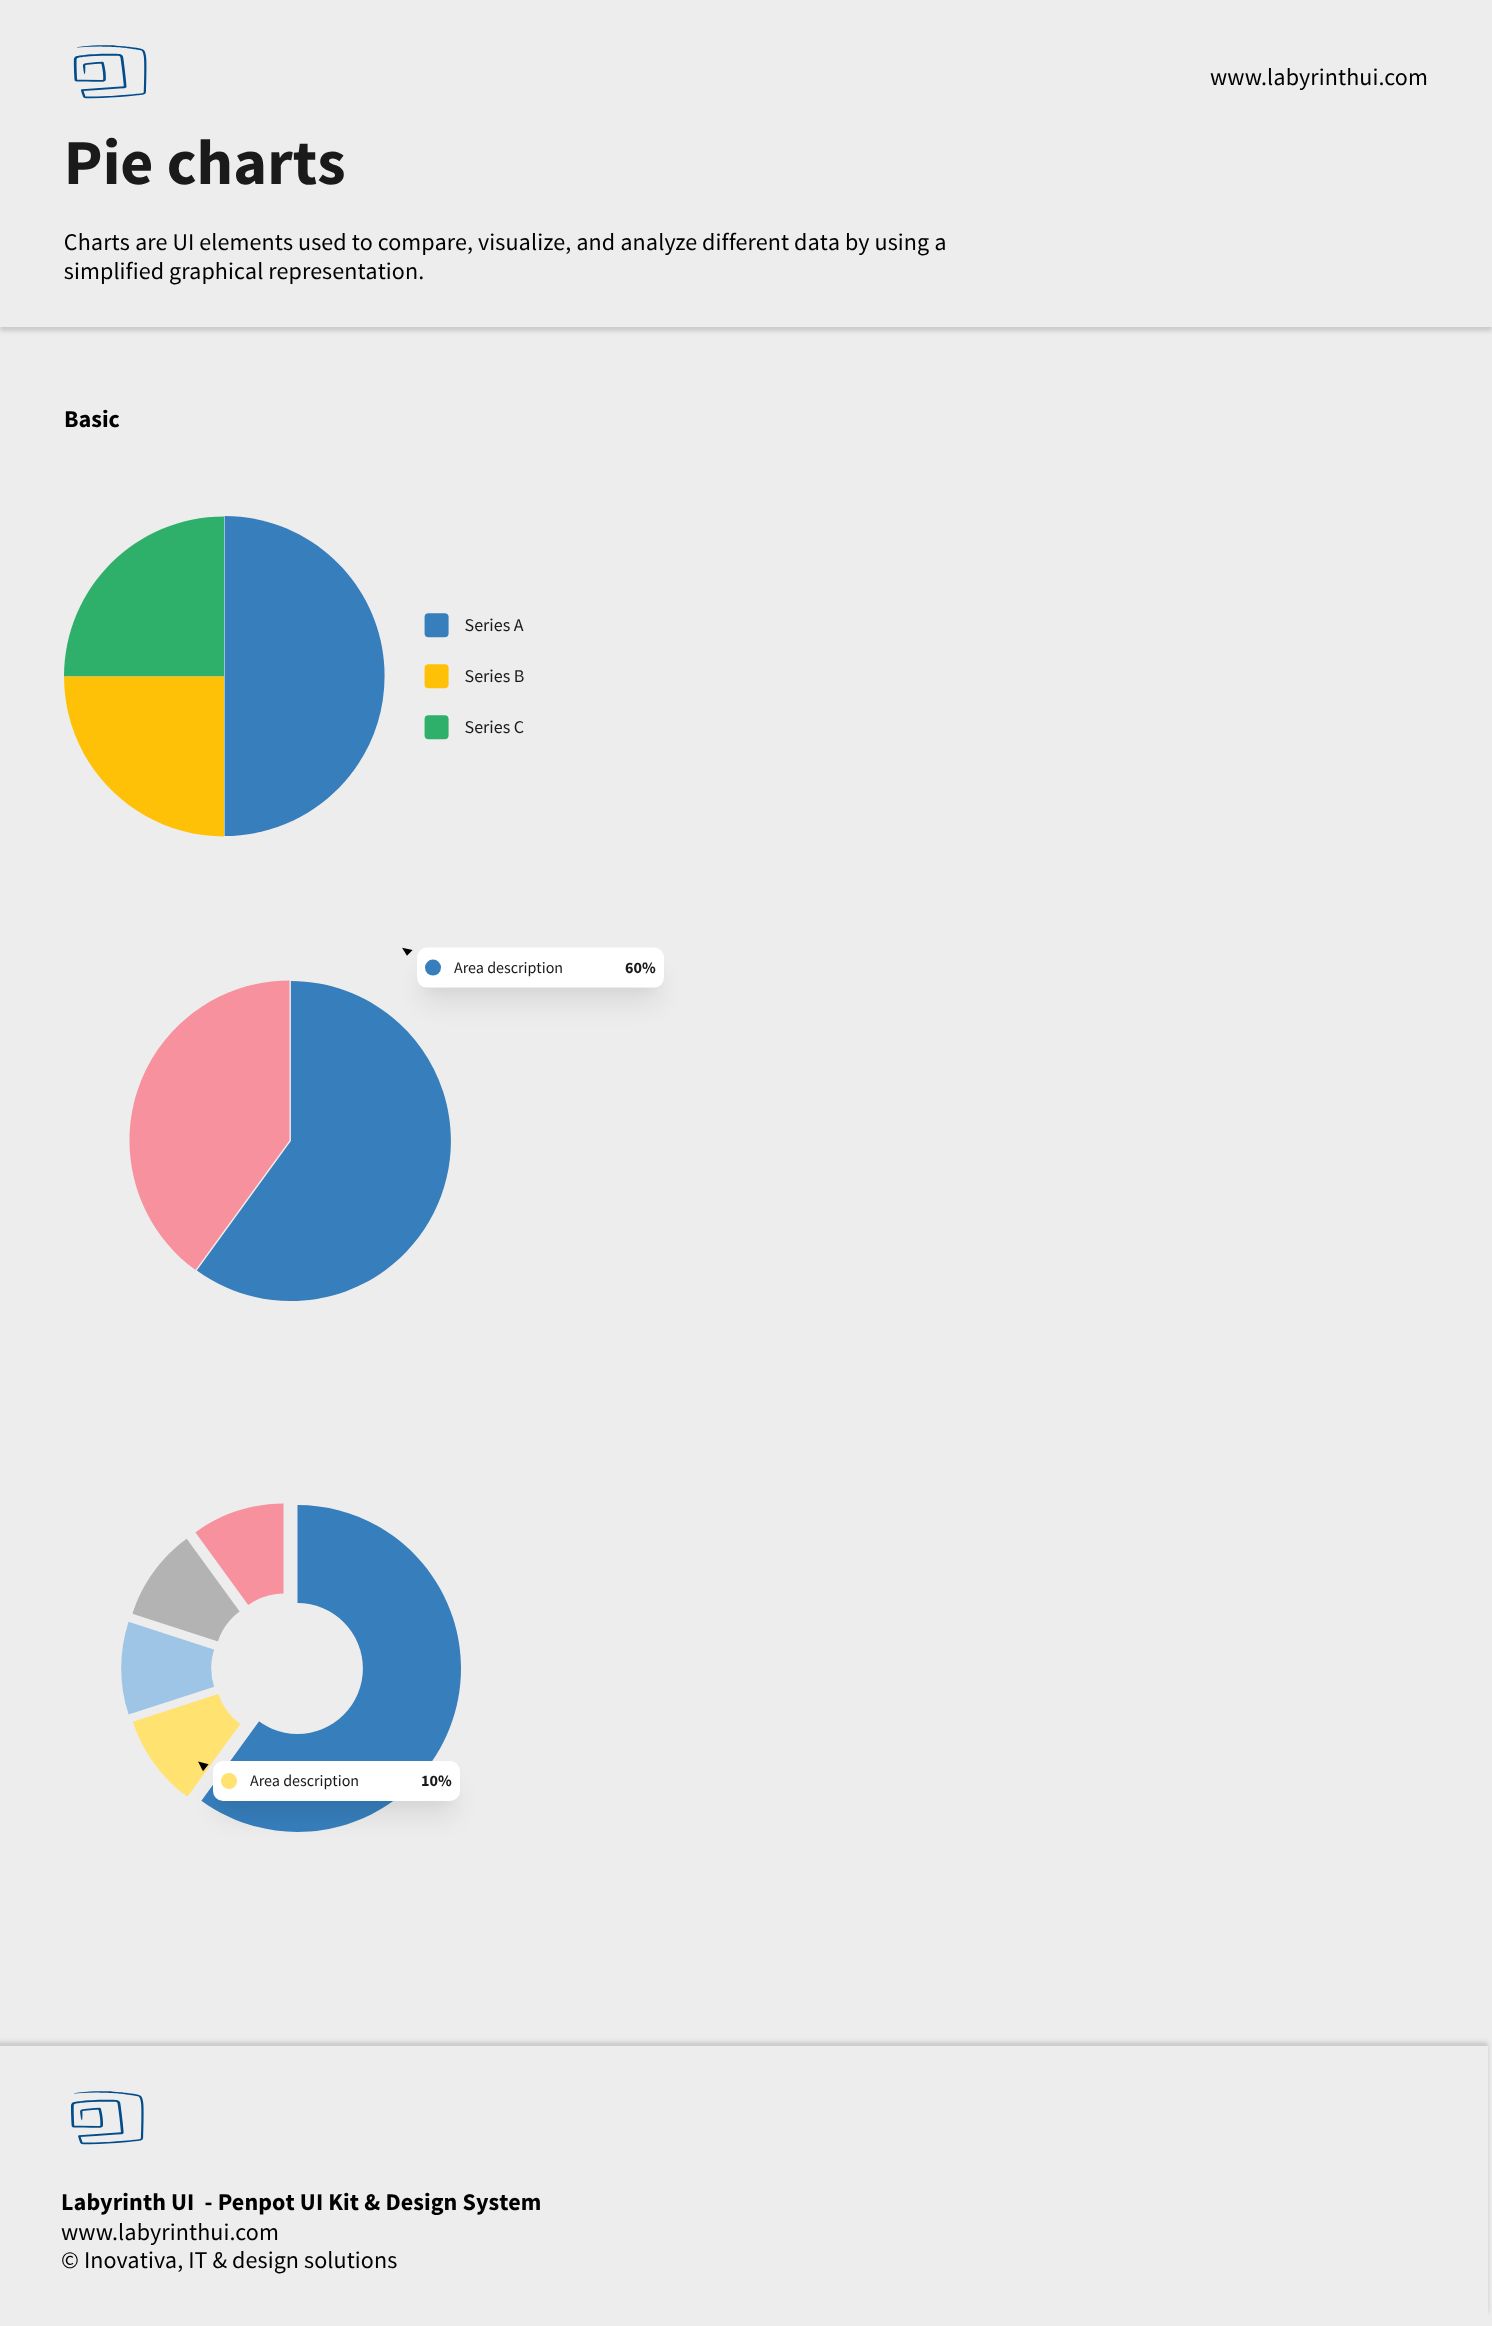
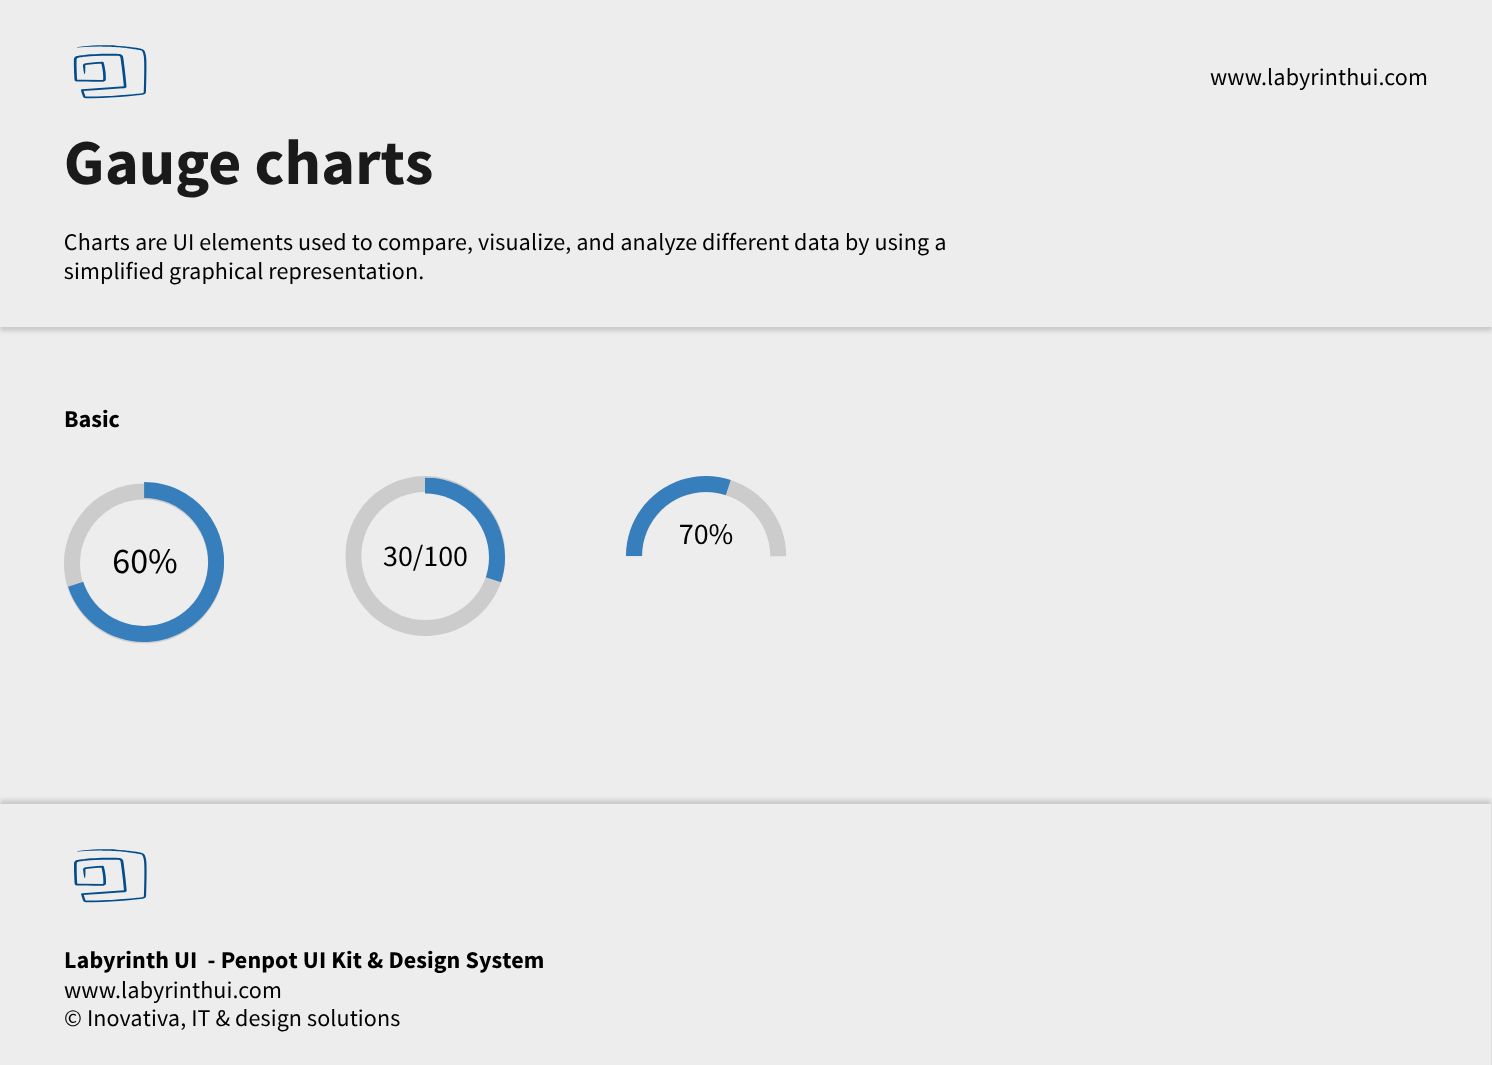
Charts (PRO)
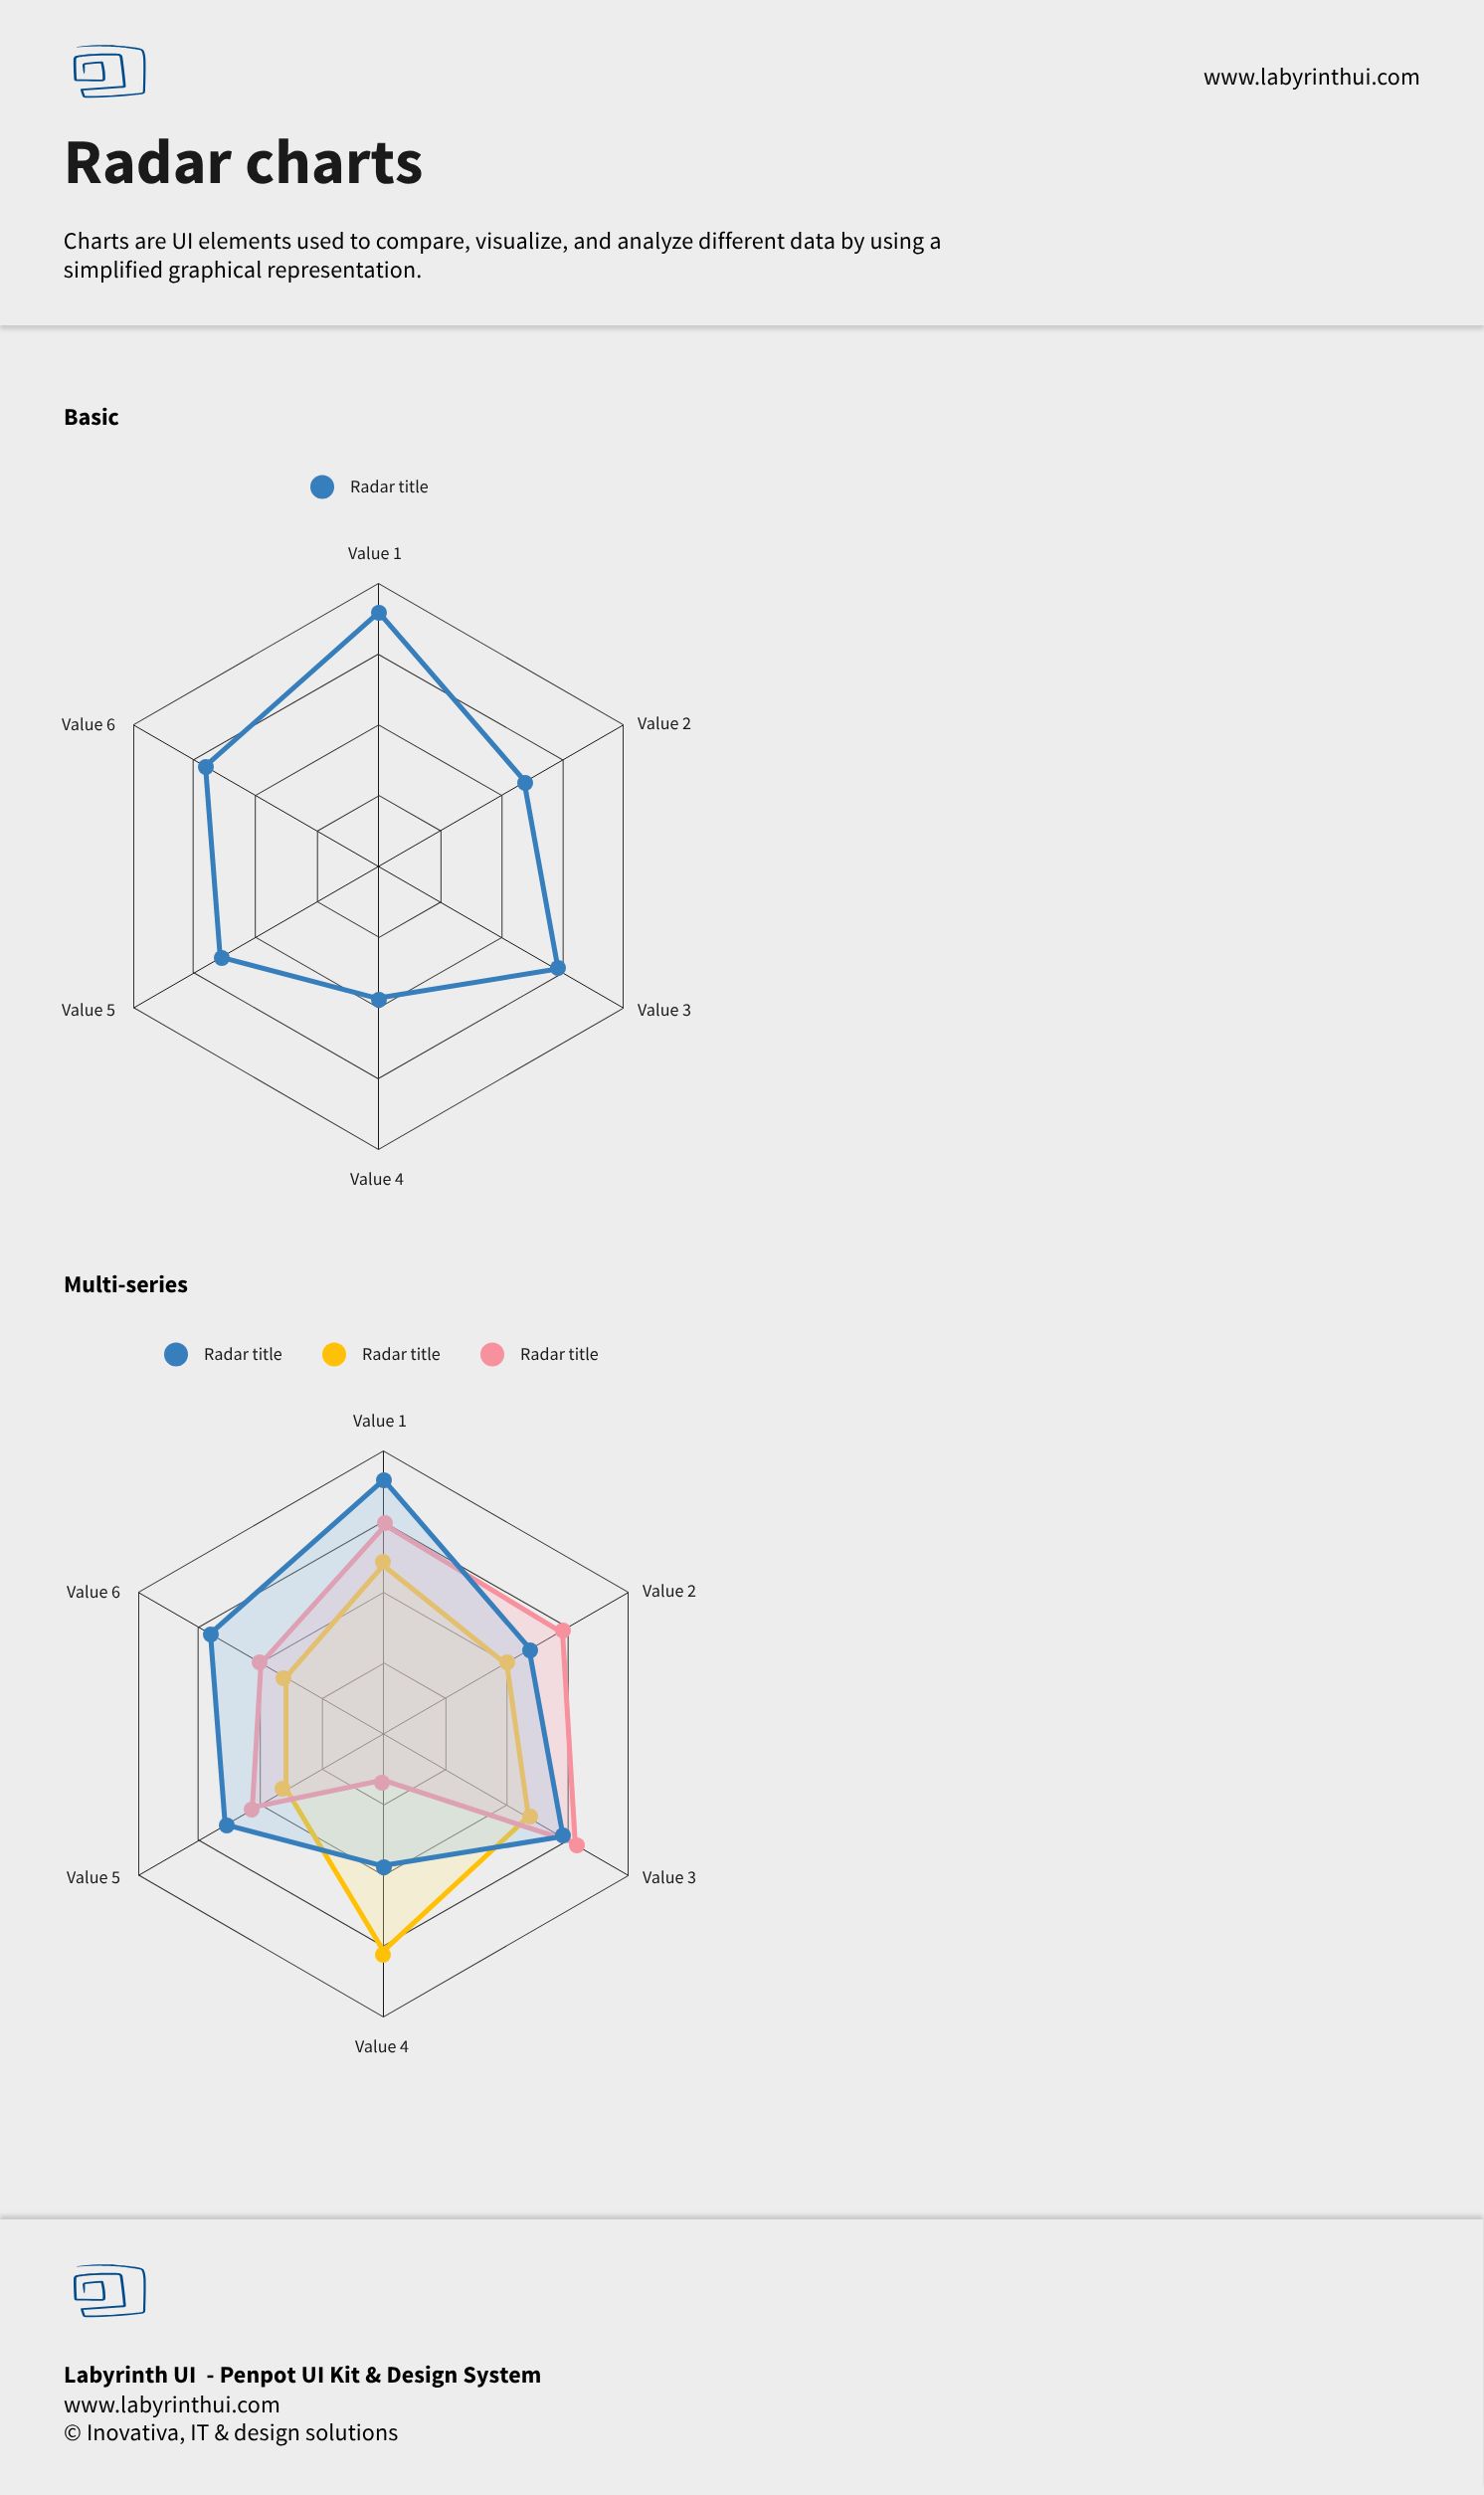
Charts are UI components designed to visually represent data, making complex information digestible, comparable, and analyzable through graphical means like bars, lines, or pies.
Chart components offer standardized styles, accessibility guidelines, and interaction patterns (like tooltips or interactive legends) to ensure consistent and effective data communication across all applications.